Monitoring
Uptime-Kuma is good for quickly understanding if a service or application is up or down and while it can also provide you with an excellent array of notification options, it doesn't really do anything else in terms of monitoring your homelab estate.
This is where a proper monitoring solution comes into play and there are many, many options.
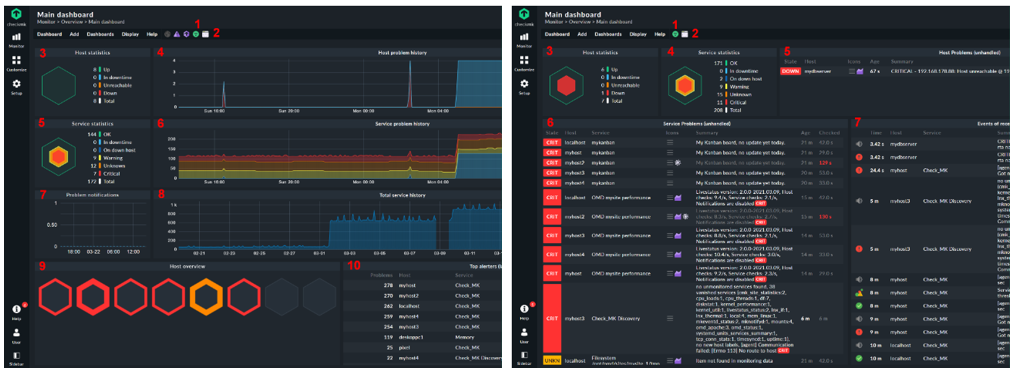
CheckMK

In my honest opinion, one of the best, if not THE best here is CheckMK. This is quite an advanced monitoring tool with many features but it needs to be implemented properly and ideally have dedicated hardware.
CheckMK will allow me to not only monitor the health and status of many different aspects of each of my devices (servers and desktops) but will also allow me to monitor the health and status of my router and access points via SNMP.
Grafana / Prometheus


I currently use (and will probably continue to use even after deploying CheckMK) Prometheus & Grafana (using node exporter and cadvisor alongside)
Grafana will essentially allow me to create some very pretty looking graphs.
There are also a number of other options i would like to explore using
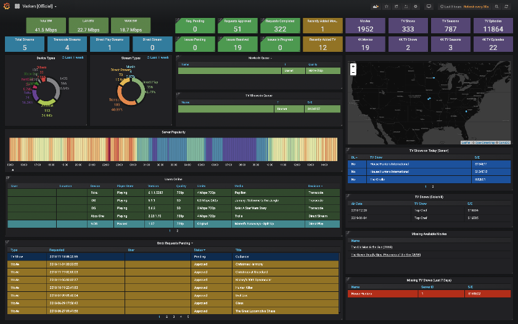
Varken / InfluxDB

Dutch for PIG. PIG is an Acronym for Plex/InfluxDB/Grafana
Varken is a standalone command-line utility to aggregate data from the Plex ecosystem into InfluxDB. Grafana can then be used to visualise this data.
example dashboard