Storage Monitor
storage.xmsystems.co.uk — live RAID health dashboard for Titan's LSI MegaRAID SAS 9260-8i controller.
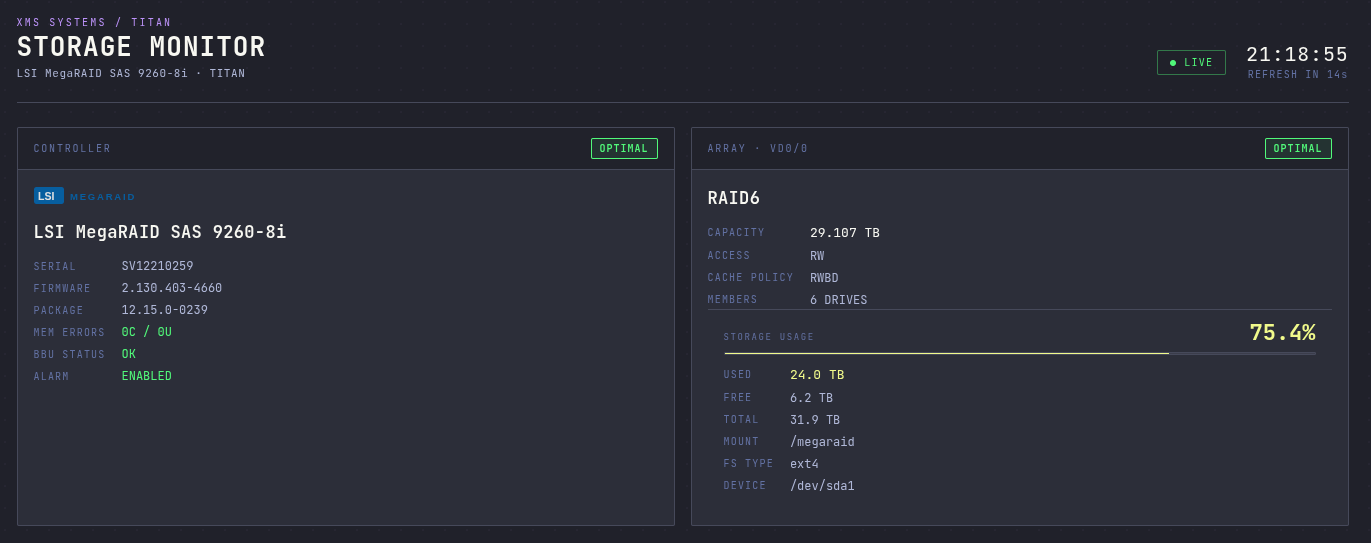
What it shows
Controller
- Model, serial, firmware and package version
- Memory error counts (correctable / uncorrectable)
- BBU (battery backup unit) status
- Alarm state
Array (Virtual Drive)
- RAID level, capacity, access mode, cache policy
- Filesystem usage: used / free / total space, mount point, filesystem type and backing device
Physical Drives
For each disk in the array:
- Slot ID and online/offline/rebuilding state
- Model, serial, capacity, interface and link speed
- Temperature, with a colour-coded gauge (cyan → green → amber → orange → red as it heats up)
- Error counters: media errors, other errors, BBM errors, predictive failure, S.M.A.R.T. status
- Power-on hours
Drives with any error flags raised get a highlighted red border so they stand out from the grid at a glance.
How it works
Browser
  └─▶ storage.xmsystems.co.uk/api/
        └─▶ nginx (Phobos, Docker)
              └─▶ proxy_pass → 10.36.100.150:9877
                    └─▶ megaraid-api (Titan, systemd)
                          └─▶ MegaRAID controller (via storcli/perccli)
- The frontend is a single static page (
megaraid.html) served by nginx on Phobos. - nginx proxies
/api/requests tomegaraid-api, a Python systemd service running on Titan (port 9877, internal only — not exposed directly to the internet). - The API queries the LSI MegaRAID controller and returns controller, array and physical drive state as JSON.
- The page polls
/api/every 30 seconds (cache: 'no-store') and re-renders the controller, array and drive sections in place.
Status colours
| Colour | Meaning |
|---|---|
Green (OPTIMAL / ONLINE) |
Healthy |
| Amber/Yellow | Degraded, rebuilding, or a warning-level condition |
| Red | Critical — offline, failed, or an error counter above zero |
Troubleshooting
- "Could not reach Titan API" banner — the
megaraid-apisystemd service on Titan is down, or the nginx proxy to10.36.100.150:9877is failing. The page keeps showing the last known good data while it retries. - Duplicated info after refresh — historical bug in the array-storage render (fixed: it was appending a new usage block into the card instead of replacing it).